
This fall marks my 16th year of teaching law students. So much has changed in the what, how, and who of teaching. The students themselves have changed tremendously, and so we instructors too have evolved. One skill that many of us have seen a decline in is deep reading. Law professor Lisa A. Mazzie discusses this in the blog post “The Effect of the Internet on Reading.” She notes this is a real problem for today’s law students because “reading and engaging deeply with text are crucial skills for lawyers.” When I started teaching, I never had to tell my students that they actually have to read cases. Now, I’m constantly reminding my student to read cases carefully, slowly, and critically. But, my reminders aren’t enough anymore.
When researching cases online, students are often overwhelmed by the number of search results and the length of entire opinions (unlike the excerpts in casebooks). Cases were intended to be read in print reporters. As professor Mazzie states, reading cases online is “challenging, awkward, and especially tiring; not only is there the issue of losing concentration with the length and depth of the reading, but also the formatting appears awkward, and the lure of more interesting information is just a click away.” So the natural tendency of today’s law students is to skim the cases. Skimming means students are missing out on the variety of ways cases can be useful for their research and writing tasks.
At the USC Gould School of Law, we provide students with reasons for why a case might be useful. We call them case selection factors. For example, some factors to consider include weight of authority, court level, depth of reasoning, factual relevancy, and decision date. These factors inform and guide students when evaluating cases, and thus encourage deep reading. But again, telling the students about these factors isn’t enough anymore.
Lately, I’ve been experimenting with infographics. Presenting information and knowledge visually, such as through graphs, flowcharts, timelines, and diagrams, is a gold standard of instructional design. For example, I used Microsoft Visio to create a flowchart for determining whether a California unpublished state case could be cited. There are plenty of other options to create infographics, such as Microsoft Powerpoint, Visme, Adobe Illustrator, Picktochart, Slidesgo, and Canva.
Early this year, I thought an infographic of the case selection factors could help students better understand the myriad of ways a case can be useful, assist with critically evaluating cases, and promote deep reading. Knowing there are many creative law librarians out there, I reached out and asked if anyone had created some kind of visual representation of the reasons to select and use cases. I was grateful to hear from a couple colleagues. But no one had an infographic with the depth and detail of what I wanted. So I got to work.
I decided to use Canva. There are different versions of Canva, free and paid. I have a Canva for Education account which provides an incredible amount of free templates and tools. It also integrates with Moodle, Blackboard, Google Classroom, and Microsoft Teams. I reviewed quite a few templates and started with a brainstorming one for my Case Selection Factors infographic. The center circle is titled “Cases” with six smaller circles branching out to represent the main factors. Each of the factors has two to five short explanatory phrases of how that case selection factor can be used when evaluating cases. Below is a sample of the infographic, specifically the Treatment case selection factor.
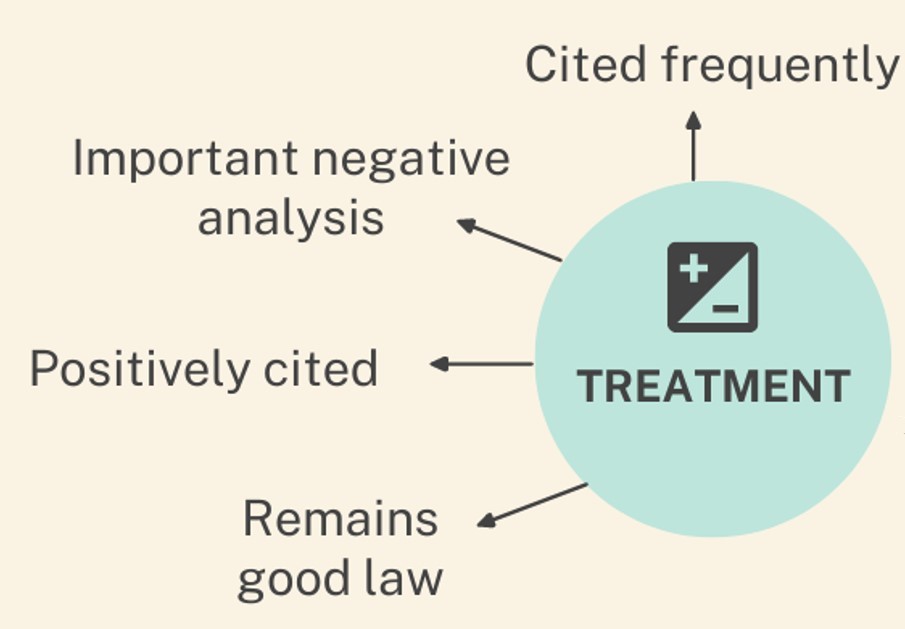 ©University of Southern California, Gould School of Law Library. All rights reserved.
I’m excited that the full infographic is included in this year’s Legal Research Course Reader, and will be incorporated into our curriculum. As teaching is my passion, I truly enjoyed the hours I spent drafting and finalizing this visual representation of the Case Selection Factors. And I hope my students find it beneficial. I’ll be advising my students to have the infographic with them while reviewing cases for their research and writing assignments. Doing so might just slow them down enough to hone the crucial skill of deep reading. Of course, I’ll probably have to print them out a copy – I can already hear them asking “paper? what’s a hardcopy?”
To obtain the full Case Selection Factors infographic, please email me directly. I’m happy to share for the benefit of our law students and future lawyers.
Editor’s Note: This article is republished with permission of the author, with first publication on RIPS Law Librarian.